Now I have the data and the next step if figuring by how much Trump properties will be effected by SLR. Fortunately Florida has done some work on this matter and created a report called The Unfed Sea Level Projection, Southeast Florida developed by the Sea level Rise Work Group, The reports author’s give local sea level rise projections for South Florida that specifically takes into account recommendations from NOAA and the USACE (US Army Corp of Engineers).
This Unified Sea Level Rise projection for Southeast Florida updated in 2015 projects the anticipated range of sea level rise for the region from 1992 to 2100 (Figure 1). The projection highlights three planning horizons:
1) short term, by 2030, sea level is projected to rise 6 to 10 inches above 1992 mean sea level,
2) medium term, by 2060, sea level is projected to rise 14 to 34 inches above 1992 mean sea level,
3) long term, by 2100, sea level is projected to rise 31 to 81 inches above 1992 mean sea level.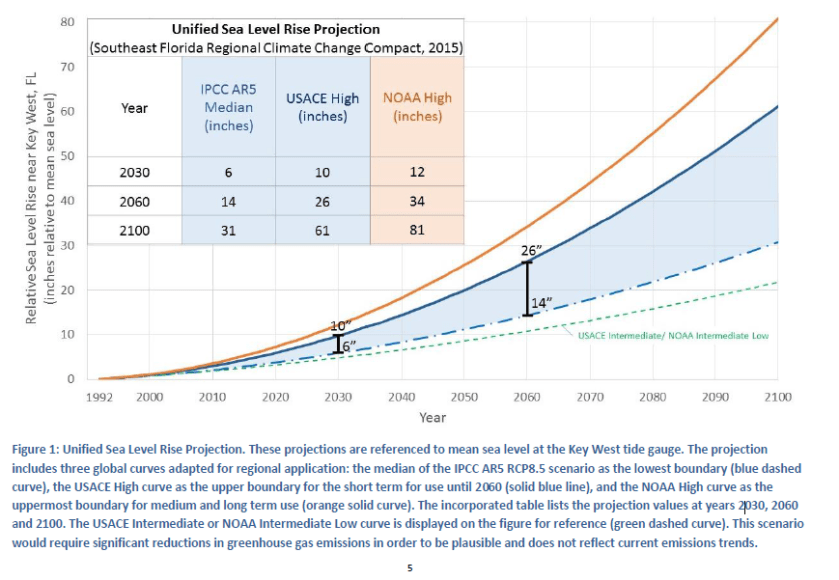
You can read the full report here.
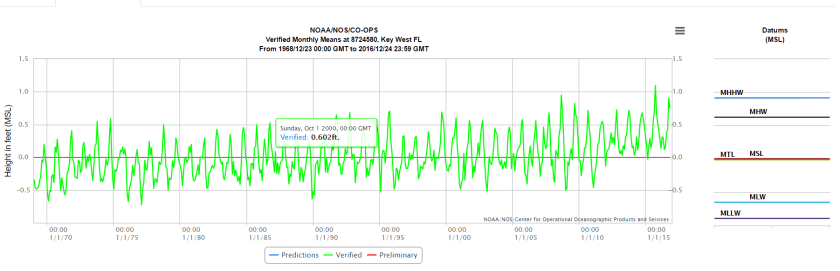
In summary the report suggests using the high curve projection. I agree with this assessment because since 1992 Mean Sea Level (MSL) has risen 6″ based on measurable data from NOAA tidal gauges. It probably isn’t a bad idea to be on the safe side.
Zooming In….
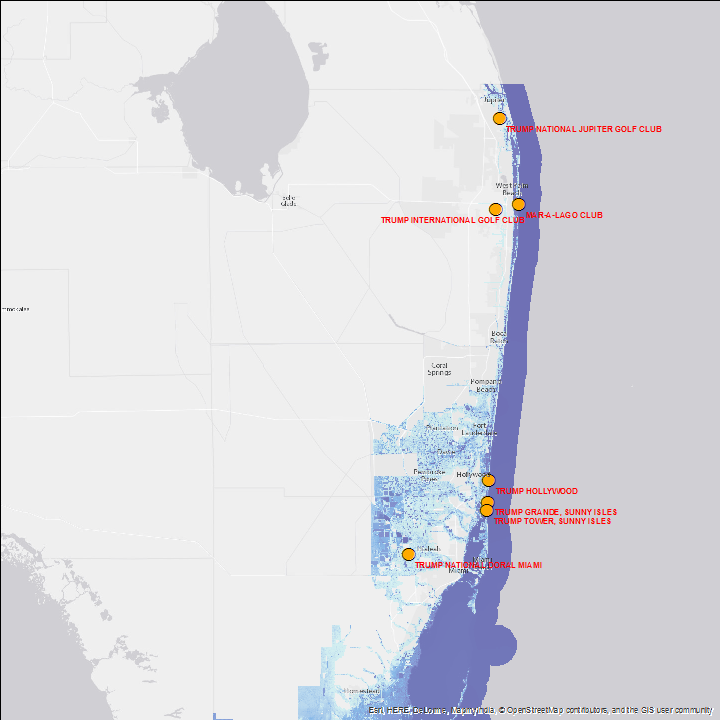
Based on that data and the report I’ve created 5 animations that highlight the extensive damage that SLR will cause to Trump properties over time.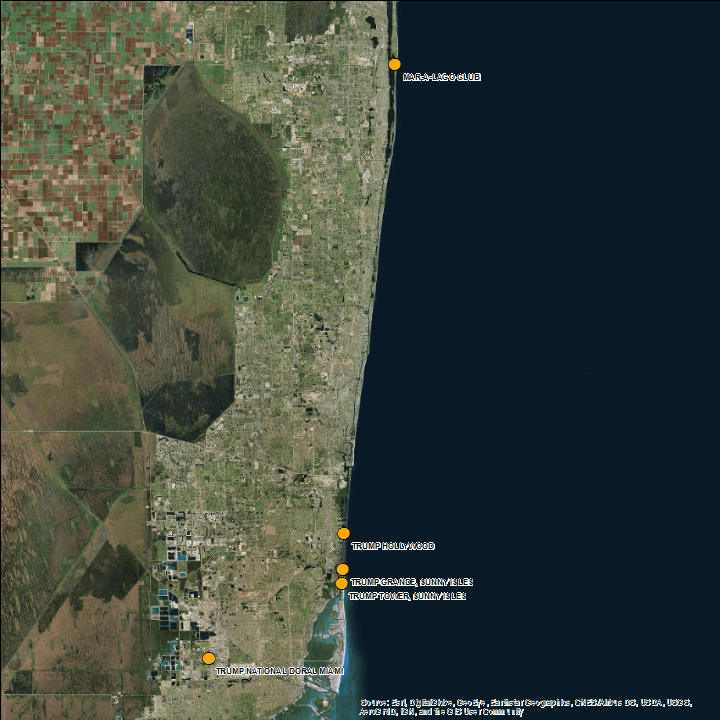
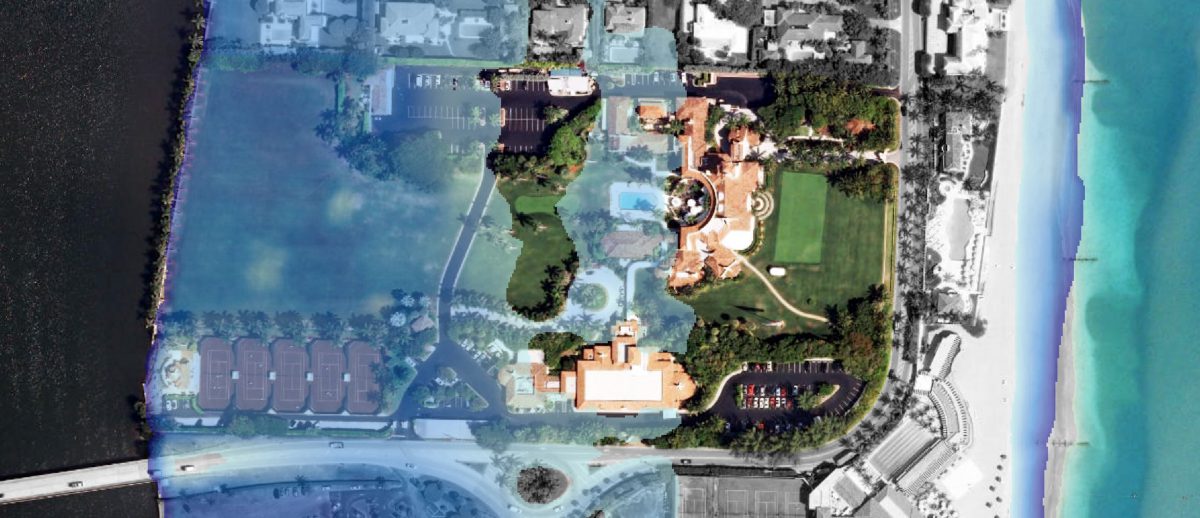
The aerial imagery is from ESRI basemaps
The sites with the most to lose are:
- Trump National Doral Golf Course
- Trump Hollywood
- Trump Sunny Isles Grande
- Trump Sunny Isles Tower
- Mar-A-Lago
Before showing the animations I want to include the following disclaimer I lifted from NOAA’s SLR viewer. My alterations are in red.
The data, animations, and maps in this tool illustrate the scale of potential flooding, not the exact location, and do not account for erosion, subsidence, or future construction. Water levels are shown as they would appear during the highest high tides (excludes wind driven tides). The data, animations , maps, and information provided should be used only as a screening-level tool for Trump. As with all remotely sensed data, all features should be verified with a site visit. The data and maps in this tool are provided “as is with some manipulations to create smoother rasters using the natural neighbor tool in ArcGIS,” without warranty to their performance, merchantable state, or fitness for any particular purpose. The entire risk associated with the results and performance of these data is assumed by the user. These animations should be used strictly as a planning reference tool and not for navigation, permitting, or other legal purposes.
In short, I am making broad assumptions on how much predicted flooding will happen during high tide, which from the looks of it, there is going to be a lot of incidental flooding everyday, but this is just a series educated predictions, based on empirical and probabilistic data research. The politics of the science only matter if you choose to ignore the data.
Trump Sunny Isles Towers from Eli Sands on Vimeo.
Trump Sunny Isles Grande from Eli Sands on Vimeo.
Trump Doral Sea Level Rise from Eli Sands on Vimeo.
Trump Hollywood from Eli Sands on Vimeo.
Trump Mar A Lagp from Eli Sands on Vimeo.
Next task is to look at New Jersey and Hawaii properties. More to come.
