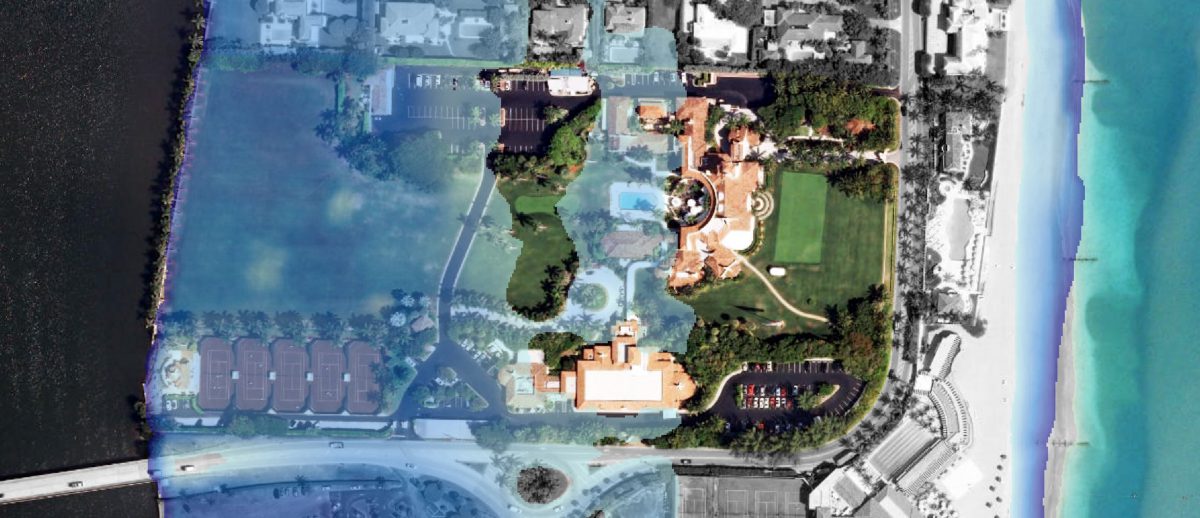

Goal: To map Trump properties that susceptible to the effects of Sea Level Rise (SLR).
SLR is an observable phenomena with real implication to humans and wildlife, and beach front real estate. Several Trump properties are especially vulnerable to effects of SLR despite our President Elect’s denial of climate change science.
Buzzfeed did an article (by: Peter Aldhous) about this very topic a year ago to highlight this issue. Click Here to read that article. This article certainly got the jump on this idea but I think we can even go further and actually incorporate local SLR predictions produced by university and government research. Also high quality aerial imagery is always sexier to look at…even if they are Trump buildings.
Where’s The Data…
One thing that surprised me is that there isn’t any Trump based GIS files on the web. I saw a lot of maps through out the past year about Trump properties, but no one is sharing the data or research on these articles. So the first step was to create a worldwide shapefile of all the Trump Properties. To do this I began parsing through the various properties at the Trump International Real Estate Site. This website has, from what I could find, the most complete list of known and visible Trump named or owned real estate locations.
*Note: While surfing the Trump International Real Estate site I noticed that the website has some very visible issues which is concerning because the owner of this website is now going to be in charge of our national cyber security.
Like the site for Trump Ocean Club just goes to a broken link with nothing to see, or the fact that nearly all the foreign real estate holdings have maps that direct you no where near the actual location of the indicated hotel.

Anyways, there was a lot of google earthing to figure it all out, but the results are a complete point shapefile for Trump Properties. Follow the link at the end of the paragraph to download the shapefile. The zip also includes a KML you can download and use in Google Earth, or an excel spreadsheet. Click here to download data.
A slideshow of the Trump Real Estate dataset at Global, US, and Florida extents. The Grey Basemap data is provided by ESRI.
Get It While the Getting’s Good.
The next part was easy. I went to the NOAA SLR Viewer and downloaded shoreline digital elevation models (DEMs) with built in SLR projections…
I think this is one thing that people don’t understand about the new administration and its ability to compromise our ability to remain informed citizens.
All of the excellent maps we see online about social and environmental issues requires data provided by the US Gov. This includes census data about poverty breakdowns, superfund sites, protected lands and waters, and a lot of aerial imagery such as the imagery created with advanced Landsat 8 satellites.
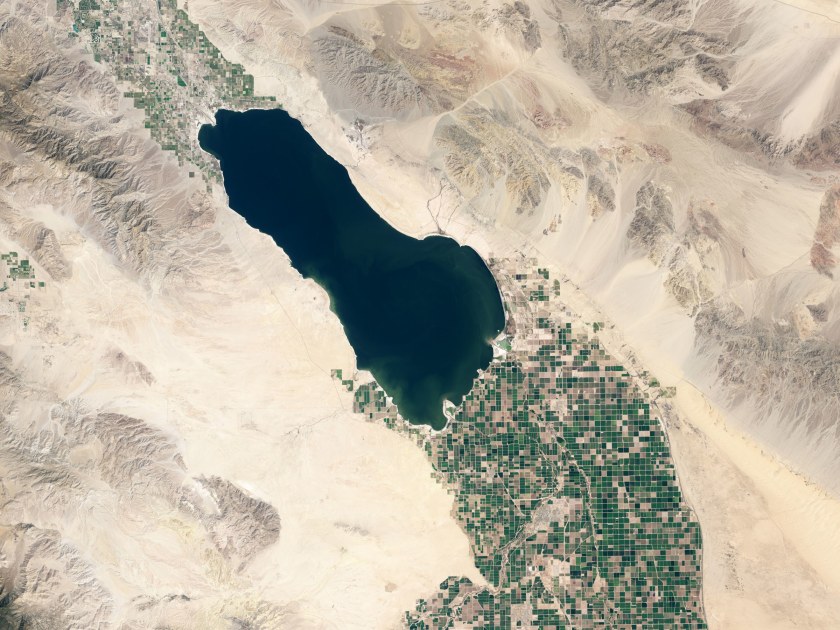
Much of the data about SLR is from NOAA. NOAA provides these SLR data and planning tools so states can start designing and preparing for the future with forward thinking.
As a landscape designer and soon to be architect, having access to good data about our shorelines will allow me to design for future landscapes and urban centers that can be built with the forethought to hopefully prevent or even improve the circumstances that will be the created by SLR, but if the data is denied or in some way altered, the planning and design community (the private sector and higher education professionals specifically) will be at a huge loss.
I am downloading as much data as I can right now before Jan 20.
